Visualize My History: Browsing History Scattergraph
Visualize My History is a free Chrome add-on developed by Mark Hansen. It falls under the category of Browsers and specifically the subcategory of Add-ons & Tools. This program offers a unique way to view and analyze your browsing history.
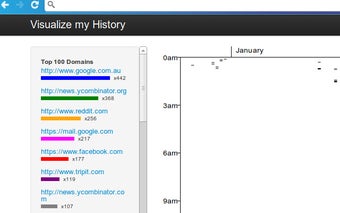
With Visualize My History, users can easily visualize their entire browsing history on one graph. The program creates a scattergraph that plots the time of day against the day, with each data point representing a specific website visited. The scattergraph is color-coded by hostname, allowing users to easily identify and differentiate between different websites.
This add-on provides valuable insights into your browsing habits by highlighting the sites you visit the most and the amount of time spent on each site. By visualizing your browsing history, you can gain a better understanding of your online activities and make informed decisions about managing your time online.
Visualize My History is a user-friendly tool that allows you to explore your browsing patterns in a visually appealing and intuitive way. Whether you're a casual internet user or a professional seeking to analyze your browsing habits, this add-on offers a simple yet powerful solution.